Client Overview
This client is a premier metal building dealer in the USA who offers an extensive range of steel buildings, including carports, garages, barns, RV covers, agricultural, industrial, commercial buildings, and other custom steel buildings to customers in 45+ states.
This steel building dealer made their mark pioneering the online building shopping experience. It is associated with the USA's various top manufacturers and sells its top-quality metal buildings in custom sizes and a range of colors and designs. Their commitment is to keep their customers satisfied by offering long-lasting structures that can fulfill their variety of requirements.
- Client: Anonymous
- Services Used: SEO, PPC, Social Media Management, Paid Social, Content Plan-Development-Marketing, Link Building, Web Design & Development, Video marketing
- Industry: Metal Building & Construction

Challenges:
This leading metal building dealers company needed help establishing a web presence to build trust and brand awareness with potential leads. Initially, there was no structured, scalable approach to paid media (on search-engines results and social platforms), SEO, and analytics that could facilitate the rapid onboarding of new customers. So, it desired a digital partner that could provide full-service digital marketing solutions, create high-utility content that drove traffic to its content hub and blog, and map customers back to their wide range of products.
Goals:
We established following listed goals in partnering with the client:
- Tailored SEO strategy with a human touch.
- To drive new customer acquisition for locations where client deliver products.
- To help the company gain organic visibility in a highly competitive industry which can boost website traffic and generate quality leads.
- Boost brand awareness, links and revenue for the company.
Our Strategy
Once we understood the client’s business, industry, and audiences and studied their requirements, we made a unique plan to help their website appear higher in search engine results. We used a growth-centric strategy that included local searches, competitive analysis, website improvement, in-depth keyword analysis, link acquisition, and creating new content.
We made a month-on-month plan to implement our digital marketing strategy. We also informed the client at every step so they knew what was happening in the project. We were transparent about their work and made reporting easy to understand for the client.
Below are the areas where we worked and continue to drive organic performance and paid media leads MoM.
- Target Audience Research – We did audience research which is a crucial component of digital marketing strategies. In this phase, we gathered information about the target audience to understand their behaviors, preferences, and needs. It helped us create target audience personas so that we could work on more targeted and relevant campaigns, design a user-friendly website, and improve overall user experience.
- Keyword Research – To improve search engine visibility, our SEO team focused on using specific long-tail keywords and addressing commonly asked questions to establish expertise and credibility. By doing so, they could target popular and competitive search queries that matched the desired search intent. Optimizing on-page elements and creating content hubs played a vital role in helping the client achieve high rankings for important search queries.
- Paid Social – Our social team initially tested different audience segments to identify the most effectively aligned with the client's objectives. Then, they experimented with various ad unit types to determine which performed best within the selected audience segments. Based on these findings, they expanded their target audience across multiple social channels such as Facebook, Twitter, Pinterest, LinkedIn, Snapchat, and YouTube to maximize reach.
- Content Plan, Development, and Optimization – The Content team collaborated closely with the SEO team to develop highly focused copy that targeted specific search queries and catered to the brand's primary target audience. They utilized keyword data, UX best practices, and heatmap results to optimize the content's structure and layout. By working together with the Development and Analytics teams, they enhanced website accessibility and improved mobile performance for an overall optimized user experience.
- Technical SEO Audit – The primary goal of a technical site audit was to make sure search engines like Google could crawl, index, and rank pages on a client's website. In this phase, we performed a technical SEO audit, a detailed analysis of the technical aspects of a website related to SEO. In this audit, we work on 200+ checklist pointers to deeply analyze the website. We majorly worked on the pointers like:
- Spot and Fix Crawlability and Indexability Issues
- Website Architecture
- Fix Internal Linking Issues
- Spot and Fix Duplicate Content Issues
- Audit Your Site Performance like Speed, Mobile Devices Response, UI/UX, User Behaviour
- Discover Mobile-Friendliness Issues
- Spot and Fix Code Issues
- Check for and Fix HTTPS Issues
- Find and Fix Problematic Status Codes
- Perform Log File Analysis
- On-Page SEO – In the on-page SEO strategy, our SEO team worked on optimizing individual webpages content to rank higher on Google. Following are some major on-page SEO activities on which our SEO team worked:
- Identify Target Keywords on the Basis of Intent, Volume, Keyword-Difficulty
- Optimize Title Tags
- Write Your Headline in an H1, H2, H3 Tags
- Write a Meta Description That Boosts Clicks
- Check the URL Slug for SEO-Friendliness
- Add Target Keywords to Your Body Content
- Review Your Content Quality
- Mark Up Subheadings with Header Tags
- Improve Navigation with Internal Links
- Add Engaging Visual Content like Infographics, Videos, Creatives
- Apply Structured Data Markup
- Off-Page SEO – In the Off-page SEO, we applied tactics to improve the website's rankings in search results. These tactics often include link acquisition, guest posting outreach, online reviews, branded searches, online reputation, events, and more to make the client's website more trustworthy and authoritative.
Results at A Glance
We Got a Tremendous Boost in Traffic, Online Visibility, Lead Volumes, Keywords Rankings, and Conversions.
We also achieved exceptional growth in the number of quality leads and annual sales for our client's business during a global pandemic.
Following are the snapshots of results for our US-based client in the metal building industry. For his metal-building company's website, he wants to boost its growth in organic traffic, search rankings of business intent keywords, and, most importantly, quality leads.
In the below-listed graphs, you can check the consistent growth in Audience, Organic Traffic, Mobile Traffic Growth, Paid Search Growth, Referring Domain & Backlink Growth, Organic Keywords Growth, and Leads (Goals).
Audience Overview:
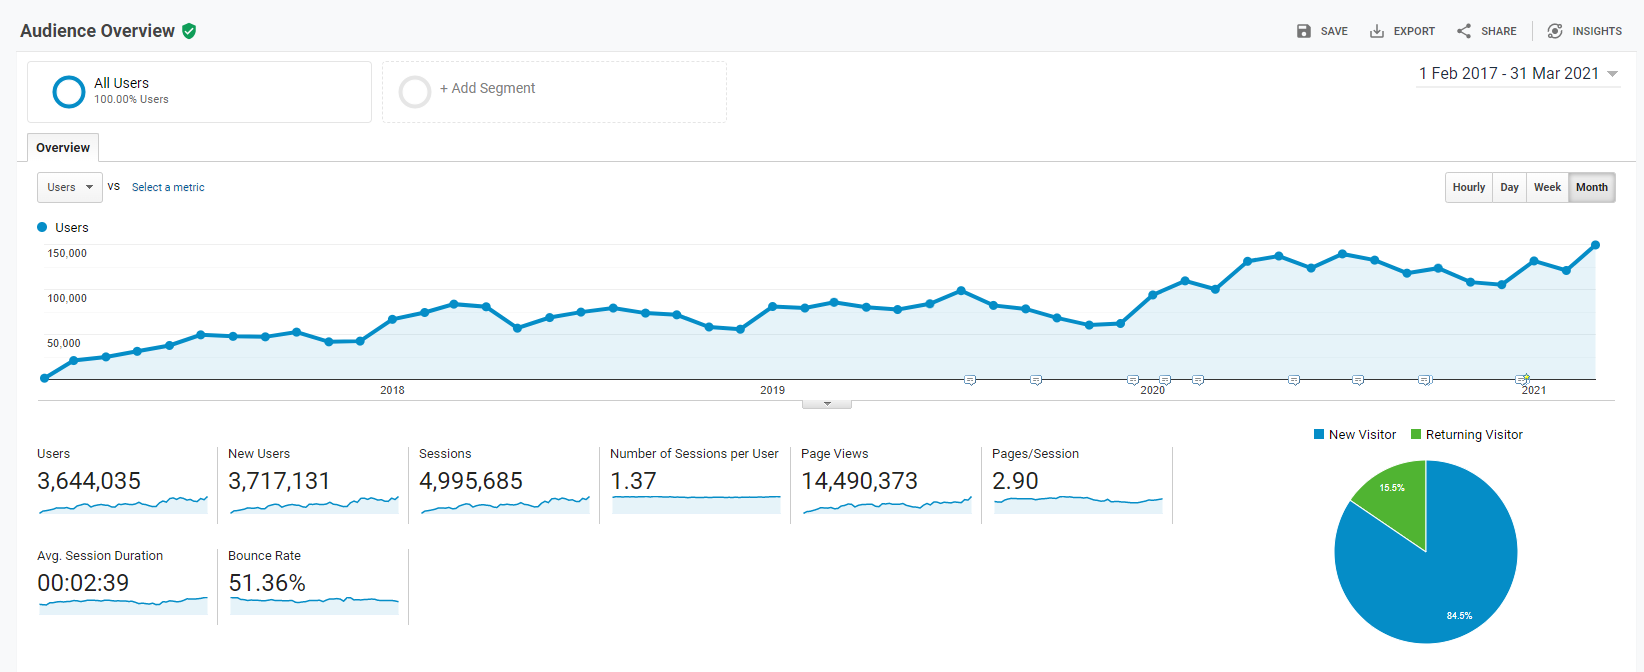
| Year | Total Users (% Growth) | New Users Growth | Page Views Growth |
|---|---|---|---|
| 1 April 2018 - 31 March 2019 | 48.50% | 44.57% | 54.65% |
| 1 April 2019 - 31 March 2020 | 14.28% | 54.65% | -5.33% |
| 1 April 2020 - 31 March 2021 | 50.44% | 53.13% | 45.73% |
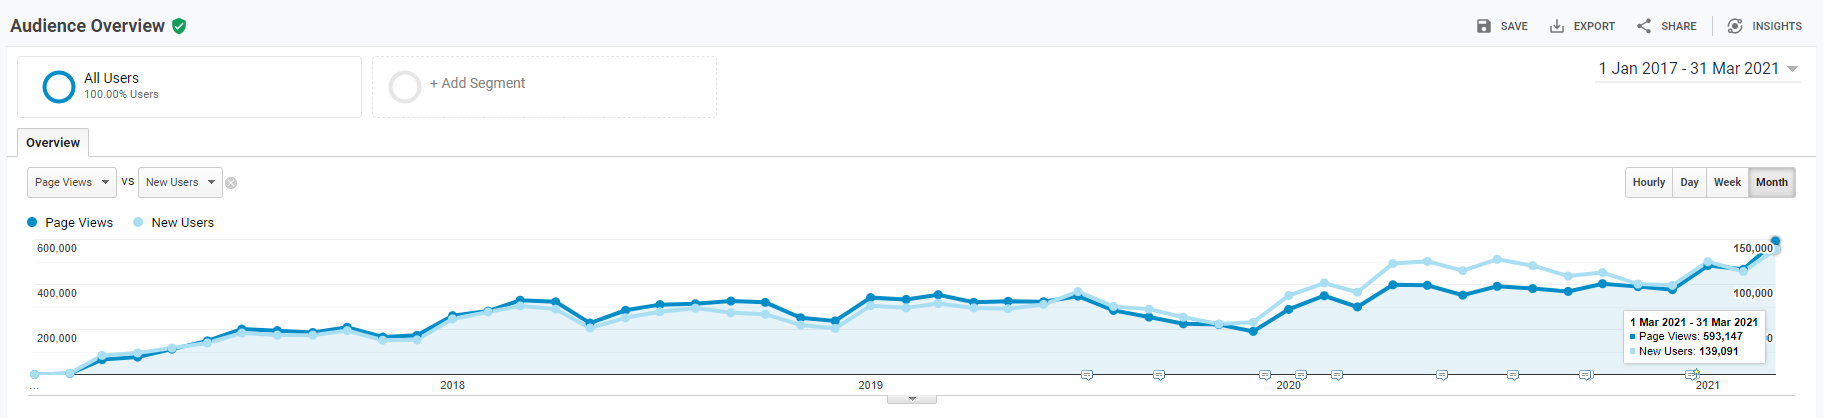
Page Views & New Users Growth:
Organic Traffic Growth:
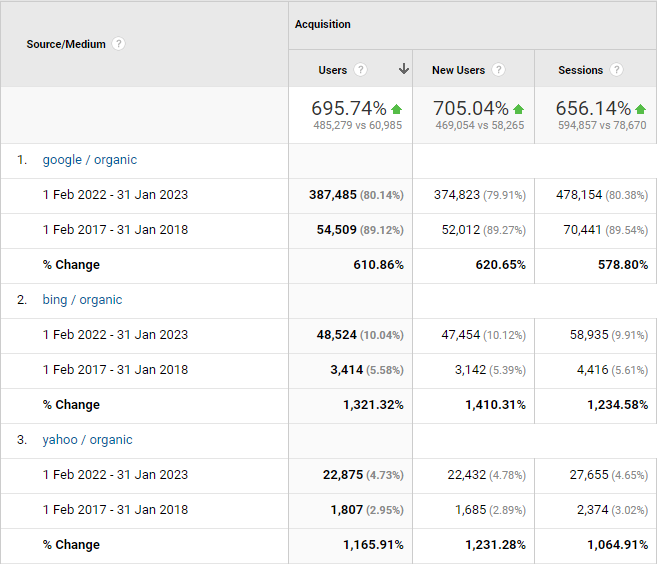
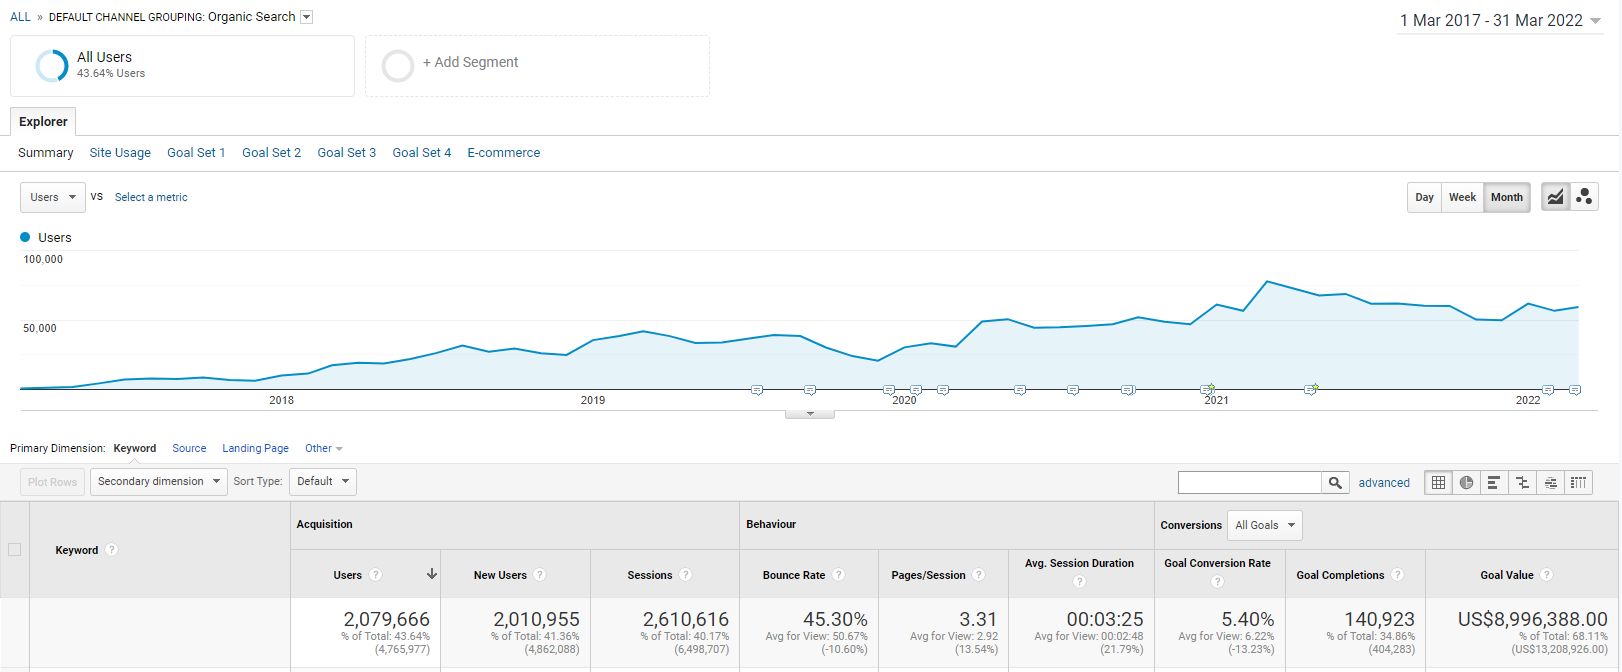
| Year | User (with % growth) | New User (with % growth) | Session (with % growth) |
|---|---|---|---|
| 1 March 2017 - 28 Feb 2018 | 70,195 | 66,974 | 91,291 |
| 1 March 2018 - 28 Feb 2019 | 305,561 (↑ 335.30%) | 290,729 (↑ 334.09%) | 374,709 (↑ 310.46%) |
| 1 March 2019 - 29 Feb 2020 | 379,941 (↑ 24.34%) | 362,712 (↑ 24.76%) | 469,919 (↑ 25.41%) |
| 1 March 2020 - 28 Feb 2021 | 550,074 (↑ 44.78%) | 529,212 (↑ 45.90%) | 688,716 (↑ 46.56%) |
| 1 March 2021 - 28 Feb 2022 | 725,153 (↑ 31.83%) | 705,032 (↑ 33.22%) | 913,879 (↑ 32.69%) |
Paid Traffic Growth:

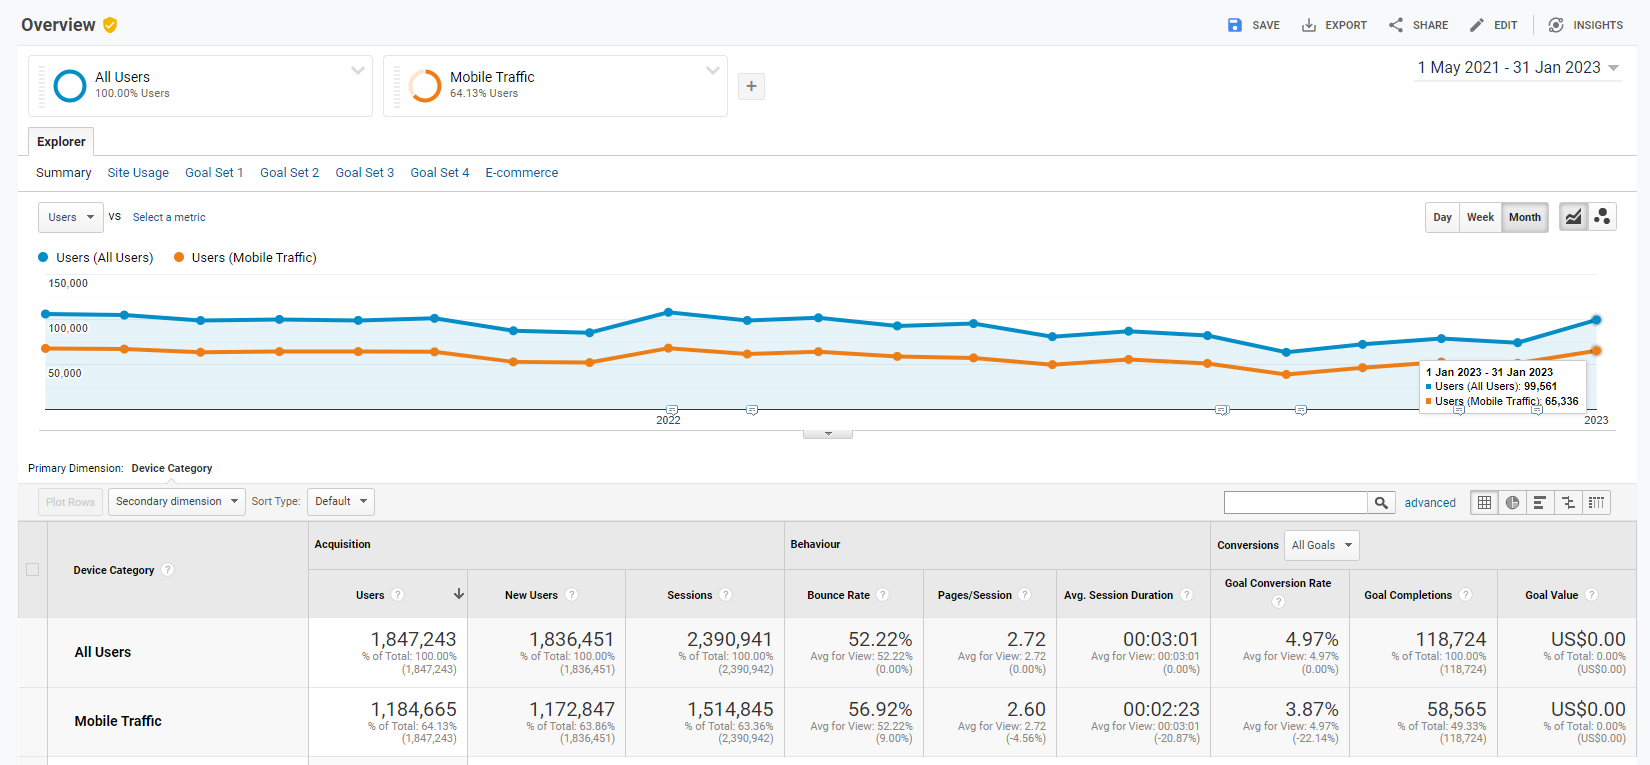
Mobile Traffic Growth:
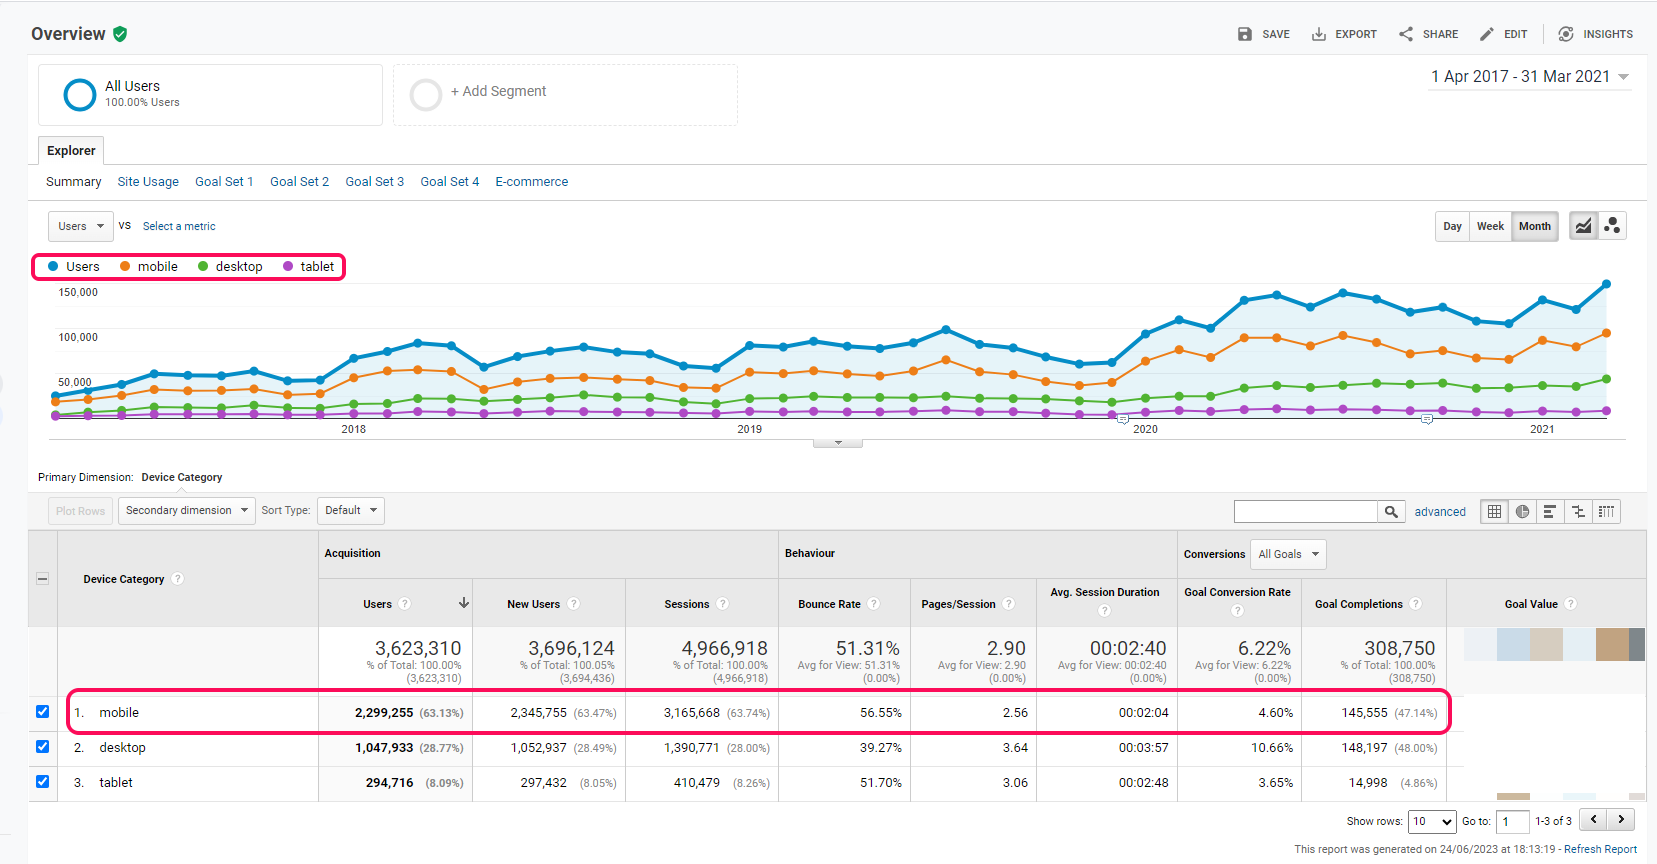
Mobile - Desktop - Tablet Traffic Growth:
Goals:
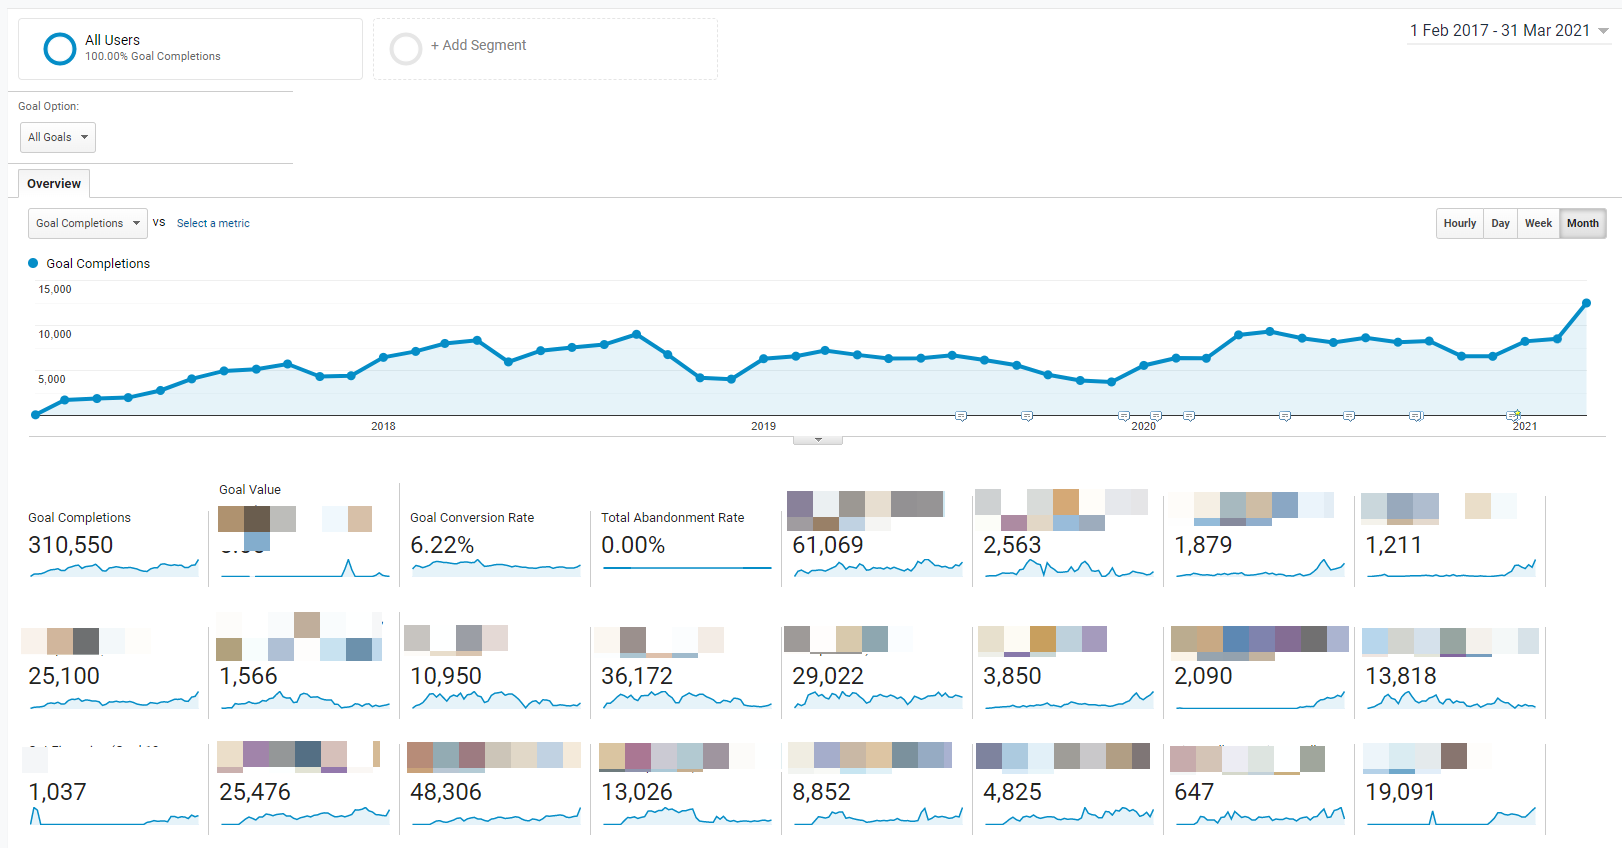
| Year | Number of Goals | Growth in Goals Completion (from the previous year) |
Goal Conversion Rate |
|---|---|---|---|
| 1 April 2017 - 31 March 2018 | 56,881 | n/a | 7.43% |
| 1 April 2018 - 31 March 2019 | 81,106 | 42.59% | 7.55% (+1.65%) |
| 1 April 2019 - 31 March 2020 | 68,288 | -15.80% | 5.59% (-25.96%) |
| 1 April 2020 - 31 March 2021 | 102,475 | 50.06% | 5.38% (-3.84%) |
| 1 April 2021 - 31 March 2022 | 93,810 | -8.46% | 6.23% (+15.94%) |
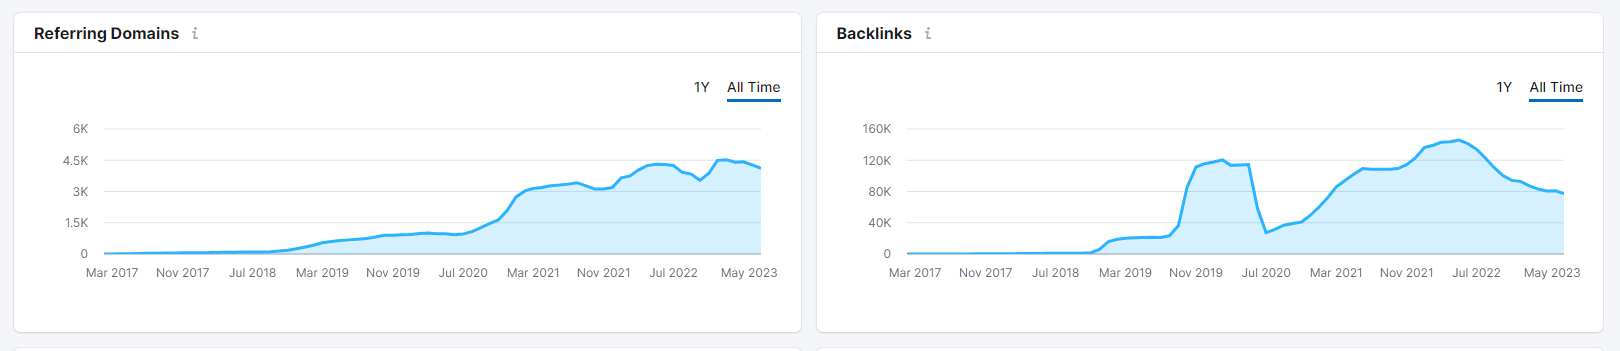
Referring Domains and Backlinks Growth:
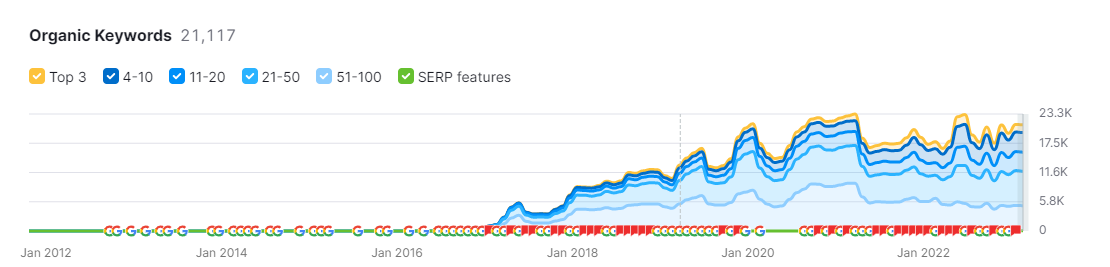
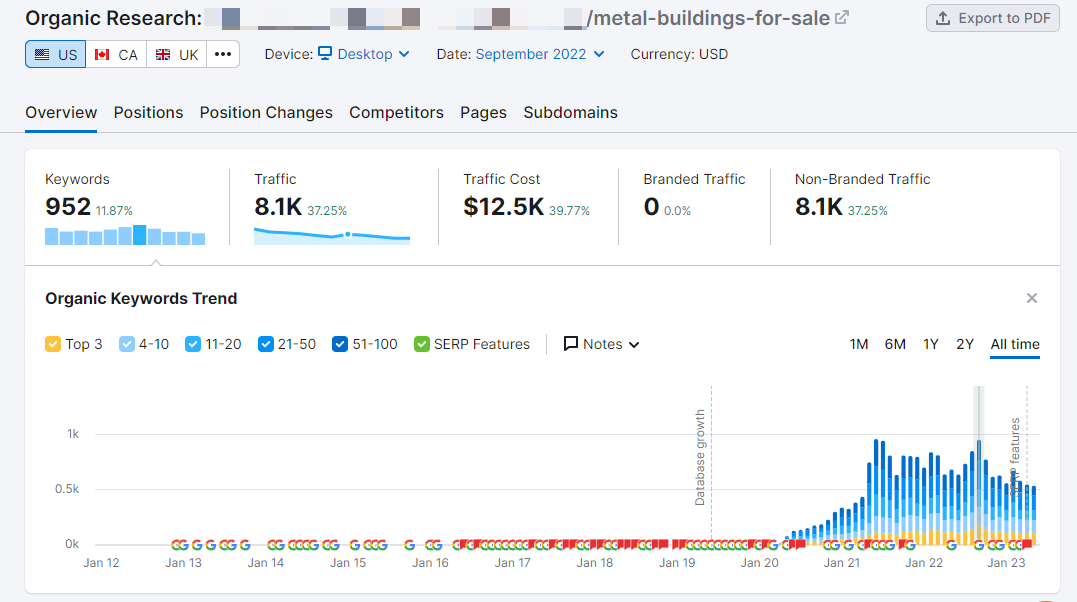
Organic Keywords Growth:
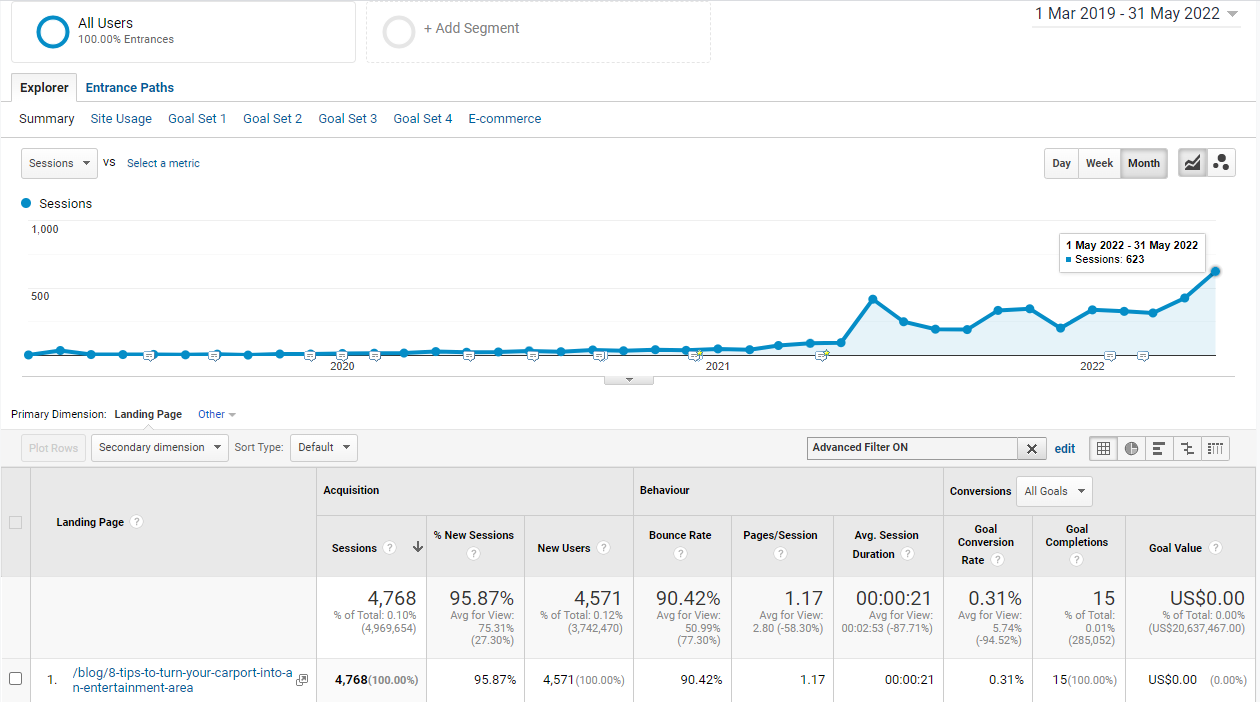
Single Blog Post Traffic Growth:
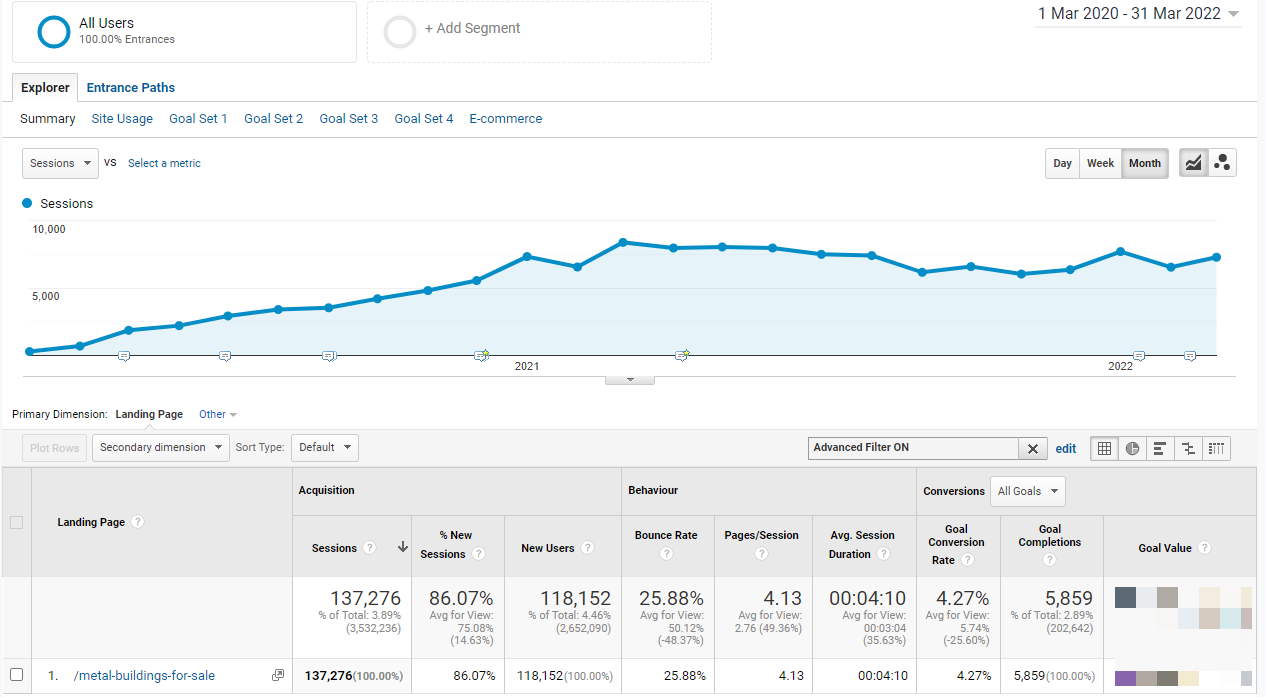
Individual Webpage Traffic Growth:
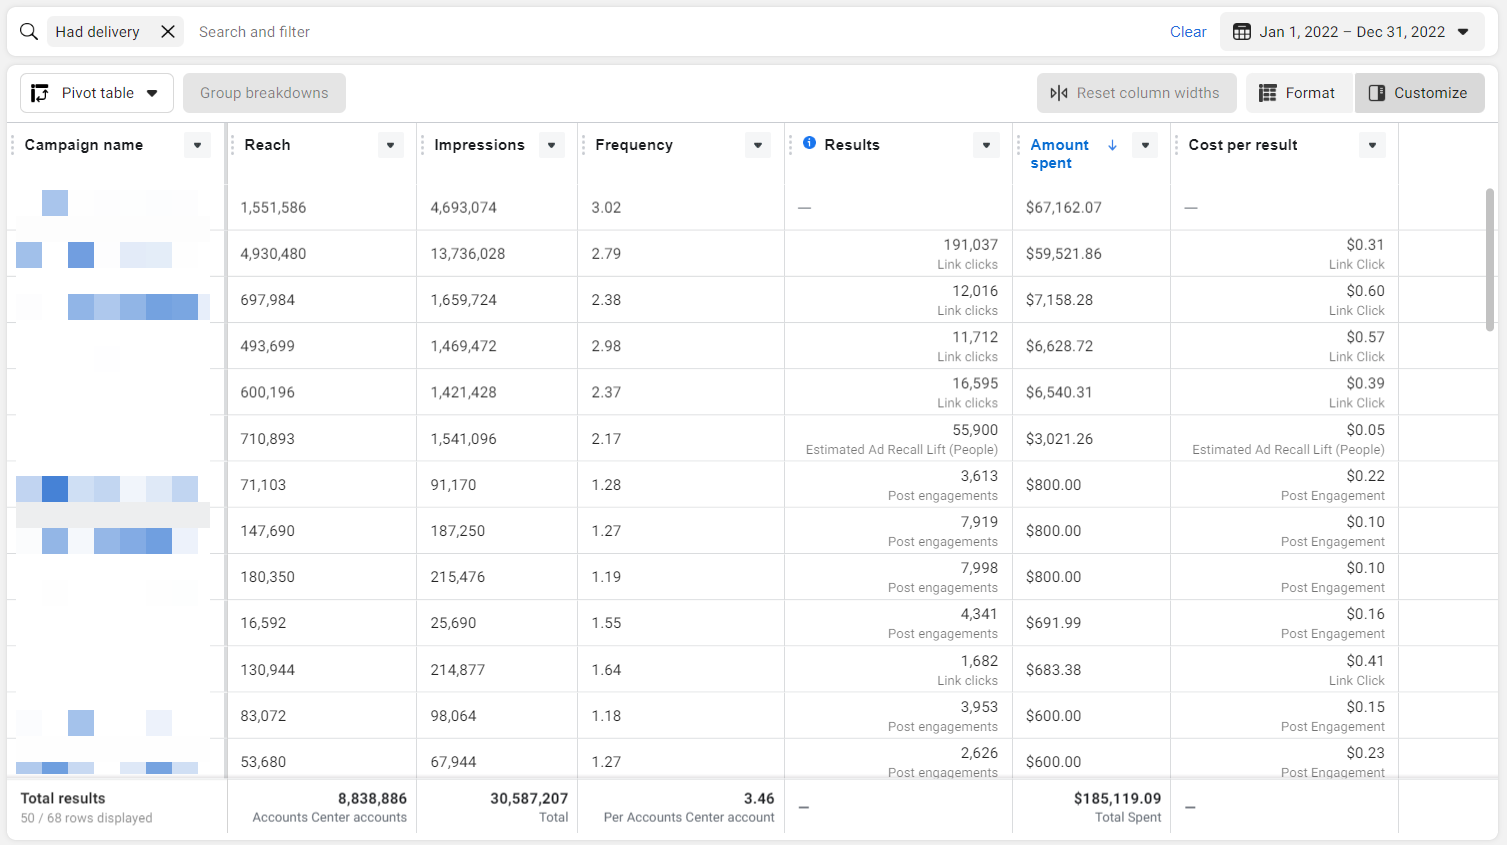
Facebook - Monthly Budget, Reach, Impression, and Cost Per Result:
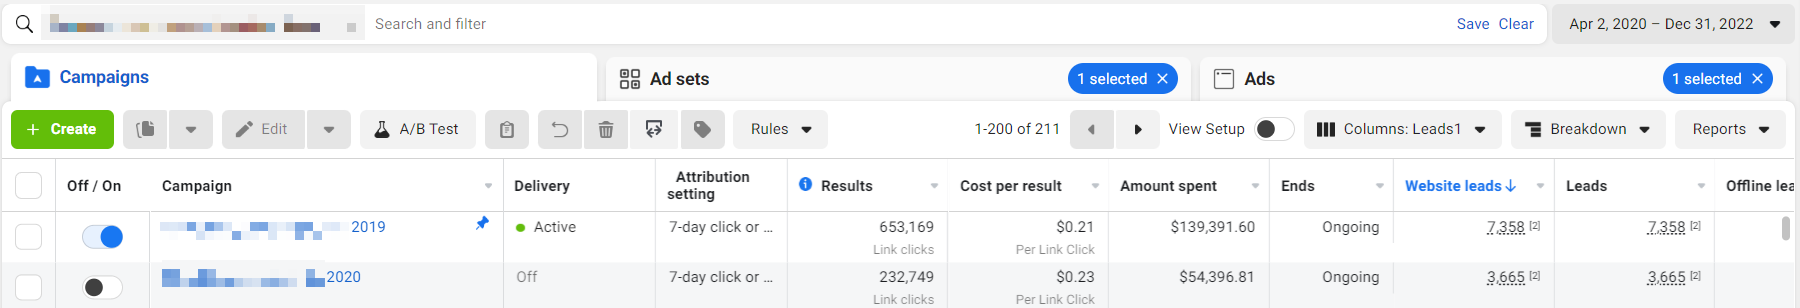
Total Leads Generated [From April 2020 - Dec. 2022]:
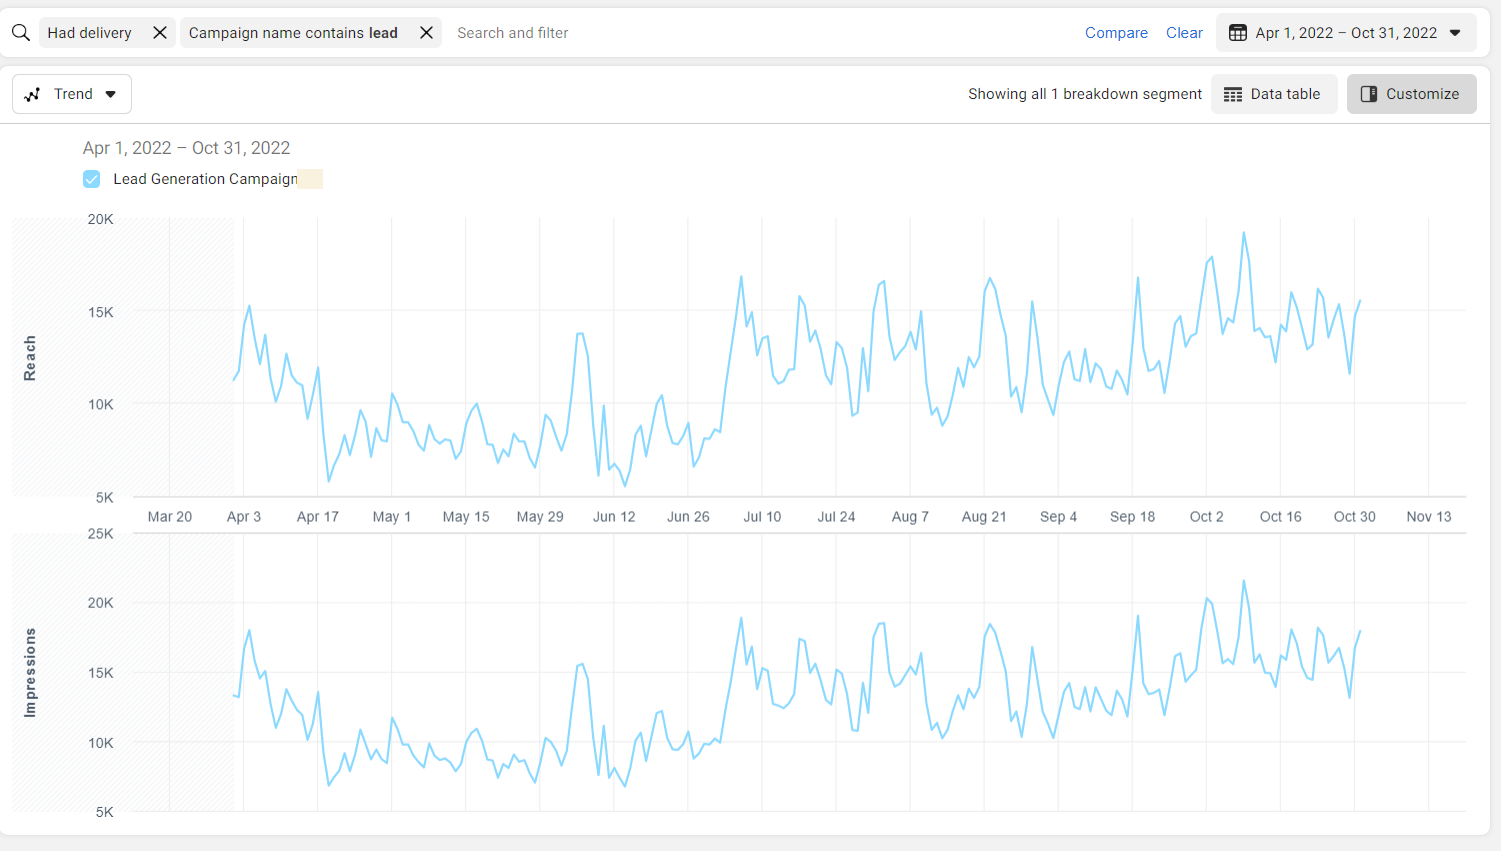
Lead Generation Campaign - Reach & Impression Growth [April 2022 - Oct 2022]: